Pitney Bowes (formerly Maponics)

Pitney Bowes Integration Highlights

  • Display locally specific polygons for better visualization of data during the home search process on your TRIBUS website
  • Overlay areas denoting ZIP codes, neighborhoods, school districts and more
  • The look and feel of these data sets can be tailored to your brand as a part of your fully custom real estate brokerage website

What do leads expect to see when searching through listings? The asking prices, of course, and some photos along with a brief description of the high points of the homes. And they also expect to see where the properties land on a map — but, increasingly, that isn’t quite enough for true, dynamic engagement. Modern users don’t just expect to see a few pins on a map of their city. They want to manipulate the map to show them all the information that matters to them on a local level. They don’t want to just search by city; want to search through specific neighborhoods. They don’t just want to see spots along a certain street; they want to view what listings are available in the school districts they want to live it. And, while MLSs allow for categorization of listings by area, this sort of in-depth, locally significant type of searching goes beyond their capabilities. For that, TRIBUS integrates with the data analytics of Pitney Bowes, formerly known as Maponics.

Acquired by Pitney Bowes in 2016, Maponics’ technology provides real estate brokerages with new levels of visualization in the home search process. Where MLSs (as well as other mapping providers like Google) have rigorously defined areas that are considered searchable, Pitney Bowes’ spatial data is much more flexible. All their data comes in the form of specific latitudinal/longitudinal boundary points, overlaid onto maps as polygons. For example, the below image — a screenshot from a home search through the website of Minnesota’s RE/MAX Results (one of TRIBUS’ fully custom real estate brokerage websites) — has several polygons denoting different school districts.

REMAX - pitney bowes

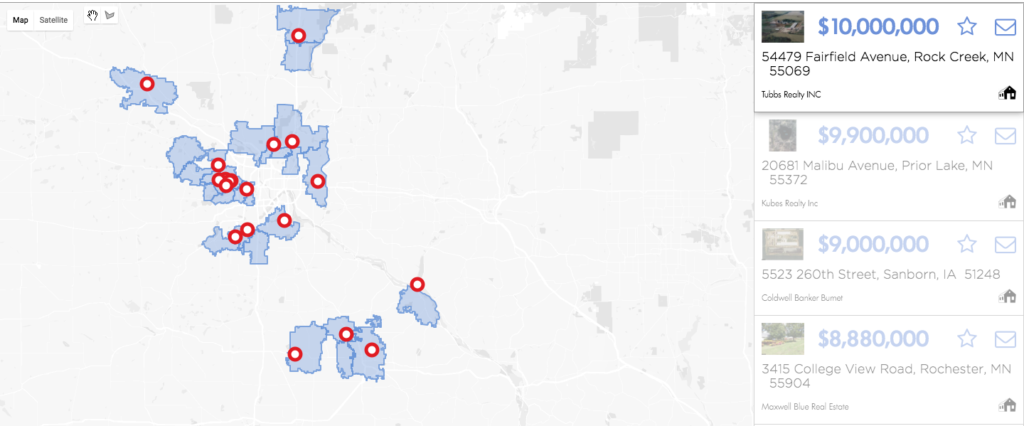
While the data we integrate with is from Pitney Bowes, the way their polygons are displayed can be totally custom to your brokerage. In the above screenshot, for instance, all the colors are brand-specific and fit right in line with the customized look for the site’s home search function. Thanks to a combination of Maponics’ original dataset and Pitney Bowes’ geolocation software, you can get highly detailed in what you display for leads while searching for homes — all contained in a very easy-to-understand visual format. For brokerages who want to really engage with leads in a locally relevant way, this kind of capability will prove itself invaluable.

Learn more about this spatial data tool here.

Unlimit Your Brokerage - Get A Brochure Now