Insights Highlights
- Agents can monitor their progress throughout the year
- Managers are given more meaningful ways to keep track of agent performance
- Several different methods of tracking progress and comparing against industry averages
That which is measured is improved…
Tracking your brokerage, office, and individual agent transactional data is vital to knowing where you stand. So we created Insights to help make this easy.
Insights allows your agents to monitor their progress as they approach their goal throughout the year. The system is automatically linked to your Transactions page, so no one has to enter the same information multiple times.
Managers, meanwhile, have never had such a dynamic way to keep track of their team before. With the ability to see up-to-the-minute reports on each agent’s activities and performance, managers are able to have more meaningful meetings with their teams about what exactly is working and what’s not. More importantly, with the easily accessible data Insights provides, managers can guide underperforming agents toward more tangible, quantifiable actions to help grow your business. That could mean the agent needs to rethink the prices of their listings, it could mean getting more leads or using more of the TRIBUS resources available to them (like blast/drip emails, for instance). Whatever the issue is, Insights is there to help steer your team in the right direction.
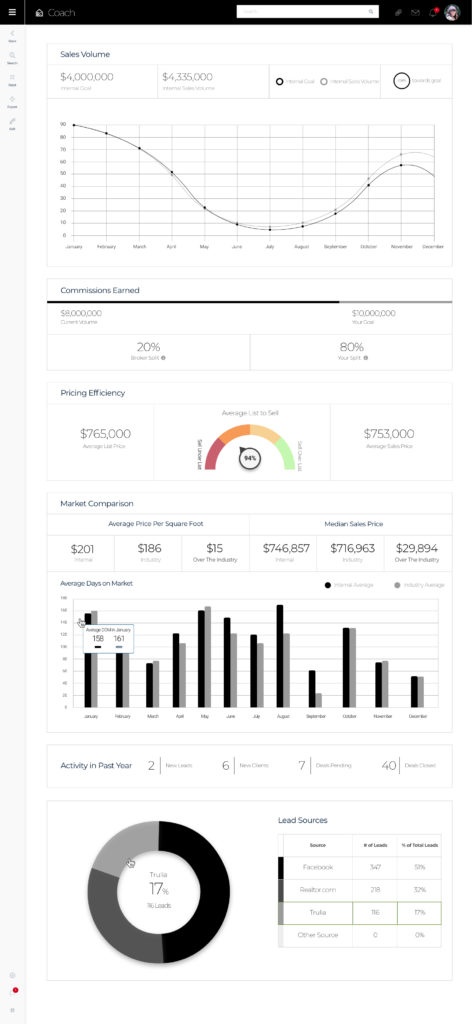
The Insights dashboard has everything your team needs to visualize and achieve their goals. With customized reports, staff can view YTD, monthly and historical reports company-wide, broken down by office and for individual agents. This will allow staff to motivate agents and view the highest producers at a glance with TRIBUS’ custom reports visualizations. Additionally, using the tabs along the left-hand side of the page, there are several handy tools to assist and guide team members:
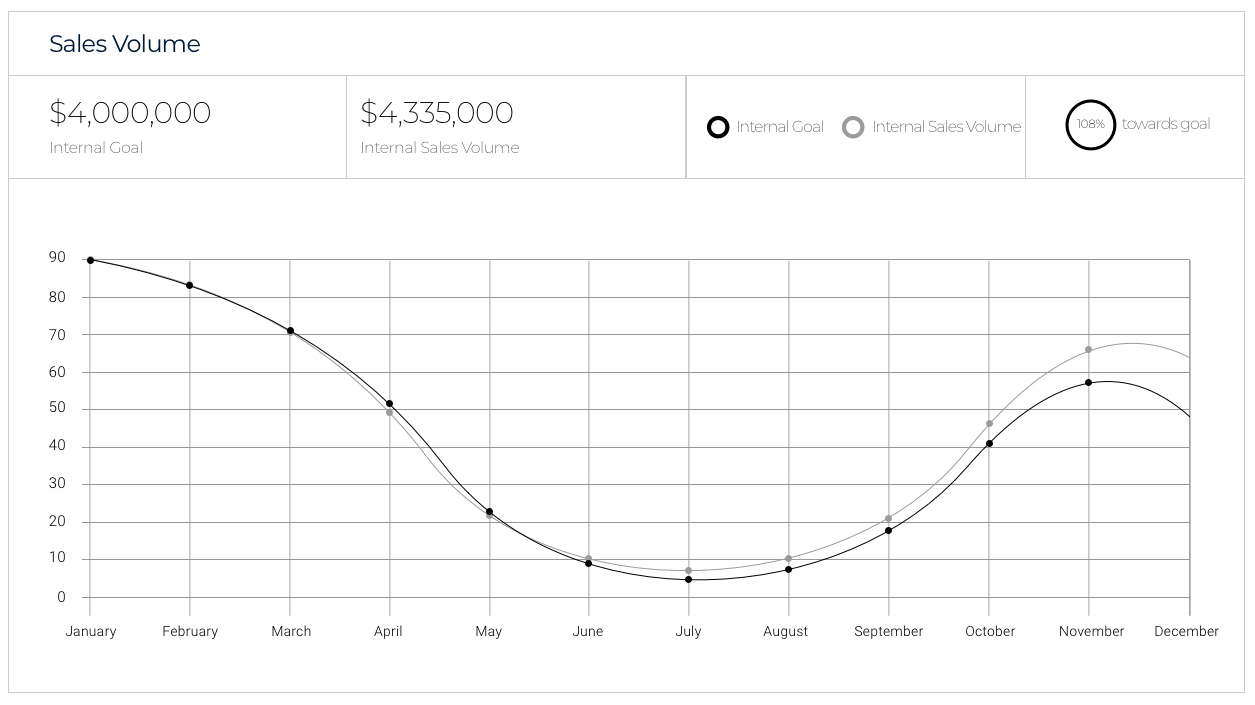
- “Sales Volume” (see above) breaks down total sales by month and shows you how you’re progressing to the goal.
- “Sales Funnel” shows how many leads have been converted to clients, how many of those clients have turned into transactions, and how many of those transactions have resulted in sales.
- “Lead Sources” puts your leads into a pie chart, visualizing exactly where all your leads are coming from, so that you can be sure you’re spending your CPC/lead spend budget effectively.
- “Pricing Stats” compares your list pricing versus your sale pricing — and shows whether sales are averaging above or below your original list price. This tool is invaluable for shepherding struggling agents in the right direction.
- “Market Comparison” stacks you up against the market data in your area, including stats for: days on market (average), price per sq. ft. (average) and sales price (median). Agents should be checking this resource regularly, and can adjust their goal as needed.
Insights puts sales metrics and reminders into an automated, online format so that nothing gets forgotten, while still encouraging staff to mentor agents within the office as well. It can be integrated with Tasks in our real estate brokerage CRM system to help agents keep track of their to-dos based upon the data. This service can of course be used in conjunction with our Coaching systems to help your agents achieve more!